How Much Caffeine is in Your Beverage?
In this lab, students will determine the amount of caffeine in a beverage. Students will determine the retention time of pure caffeine. From this information, students will be able to identify the caffeine peak in the sample’s graph. Students will calculate the area under the caffeine peak. Using the calculated area and a calibration curve, students will be able to determine the mg/mL of caffeine in the beverage.
Link to Virtual Lab Student Handout: How Much Caffeine is in Your Drink?
Teachers: Request an Answer Key
Introduction
Caffeine has been used for centuries to help mankind stay awake and gain energy. While getting plenty of sleep and eating well are recommended to keep your mind and body in top performance, many people choose to try to get an edge chemically. Caffeine is a stimulant that will help to keep you awake and suppress your appetite. Caffeine is also a diuretic, which means that it can dehydrate your body. People who drink nothing but highly caffeinated drinks can end up in the hospital after passing out due to severe dehydration.
Daily consumption of 200-300 mg of caffeine is usually safe. More than 300 mg of caffeine could have negative effects on the body, such as restlessness, anxiety, irritability, muscle tremors, sleeplessness, headaches, nausea, diarrhea, and abnormal heart rhythms. In addition, like other stimulants, regular caffeine use could have harmful effects on the body. Specifically, children and teens, whose bodies are still growing, should limit caffeine use. Overuse could stunt muscle development and limit the body’s potential growth development.
- FDA guidelines related to caffeine consumption
- CDC Healthy Schools: The Buzz on Energy Drinks
- BWell Health Promotion: Energy Drinks
- Find caffeine amounts and calories of most drink brands and types
- Caffeine Content of Selected Foods, Drinks, and Drugs
Caffeine molecule
You will use a high performance liquid chromatography instrument (HPLC) to analyze caffeine in various beverages. The main parts of the HPLC include the following:
- Pump. If you are close to the instrument, you will hear the pump working. It pumps the mobile phase and sample through the stationary phase. The pump is set to have a constant flow rate.
- Mobile Phase. This is a mixture of methanol, water, and acetic acid (vinegar). It will carry your sample through the stationary phase.
- Sample. This is what you are injecting into the instrument. In this lab, you will inject a caffeinated drink (soda, tea, coffee, energy drink) into the instrument.
- Stationary Phase (Column). This separates the caffeine from the other parts of the beverage. The separation is based on polarity, which will be discussed below.
- Detector. This will measure the amount of each component in your sample and produce a graph printout. The bigger the caffeine peak, the more caffeine that is in your sample. The size of the peak will be measured by calculating the area under the peak.
- Retention time (Rt). The rate at which the sample components pass over the stationary phase. Different components are indicated by different peaks relative to the rate at which they elute out of the stationary phase (column).
The HPLC used in this lab has a column that has been carefully packed with C-18 particles, which are less than 10 micrometers in diameter. Since the particles used in the column are so small, it is necessary to pump the mobile phase (a 30% methanol solution) through the column at high pressure (between 3500-3800 psi). The pump keeps a precise flow rate so that the peaks of each sample component can be measured in time. This is then compared to prepared standards of the particular component of interest. The peak area of the component of interest (caffeine) will then give us a quantified mg/ml value for each sample tested through the use of a calibration curve.
Polar molecules have a dipole, meaning both a positive end and a negative end. Usually, polar molecules (like caffeine) are asymmetrical, while nonpolar molecules are completely symmetrical. In the HPLC, the stationary phase is a column consisting of a long tube that is packed with small, relatively non-polar molecules. The mobile phase contains a polar methanol-water mixture with acetic acid added to adjust the pH. Polar compounds in a sample will be more attracted to the mobile phase than the stationary phase, while non-polar compounds will be more attracted to the stationary phase. The polarity of each compound impacts the compound’s retention time, or time needed to move through the column. Compounds that are attracted to the column (non-polar compounds) will take longer to move through the instrument than compounds that are attracted to the mobile phase (polar compounds).
Procedure
Sample Preparation
- Samples were degassed (let the fizz out) and diluted (1 part beverage to 1 part distilled water). Gas bubbles can interfere with the column, and undiluted drinks will clog the column.
- Samples have to be filtered before making the injection. This will remove any small particles that could interfere with the liquid’s movement through the column. To filter each sample:
- FIRST: Draw the diluted beverage into a 3mL plastic syringe labeled with your beverage name.
- SECOND: Connect the 0.20 micron mini-filter to the end of the 3mL plastic syringe.
- Push the beverage through the filter and into a small vial or beaker.
Injection Syringe Preparation
The glass injection syringe must be rinsed with the diluted beverage sample to prevent contamination of the sample.
- Fill the 100μL glass injection syringe with the filtered sample and empty it into a waste beaker. Do this THREE times.
- Slowly fill the injection syringe with approximately 50μL of the filtered beverage.
- Check the injection syringe for bubbles. You do not want to inject bubbles into the instrument. If you see bubbles in the syringe, empty the syringe into a waste beaker and redo Step #4.
Injecting the Sample
The sample will be injected to a port at the top of the HPLC.
- Check that the knob, on the port at the top of the HPLC, is aligned with the LOAD position, and insert the syringe needle.
- Inject the prepared syringe by pushing down on the plunger.
- Immediately switch the knob to the INJECT position. LEAVE THE SYRINGE IN THE PORT WHILE THE SAMPLE IS RUNNING!
- After making the injection, three pieces of information will need to be recorded:
- Mark the Caffeine Peak on the chart.
- Measure the Retention Time of the Caffeine Peak.
- Absorbance Units Full Scale (AUFS) refers to the attenuation of the UV detector for a particular run. This setting is used to make the peaks on the chromatogram a certain height. For this lab, it is suggested to use 0.5 as your AUFS value.
- It will take several minutes for your sample to completely move through the column. After the last peak is recorded, switch the knob back to the LOAD position and remove the syringe.
Calibration Curve
A calibration curve is a method used in analytical chemistry to determine the concentration of an unknown solution. A calibration curve is a graph of standard solutions with known concentrations.
In the following calibration curve, the equation of the trendline is: y = 12.2*x + 0.0432
Access this calibration curve as a Google Sheet by clicking here.
Results
Watch the video: Caffeine Analysis Using HPLC. Choose from the following chromatograms to complete the Data Analysis section of the Student Handout.
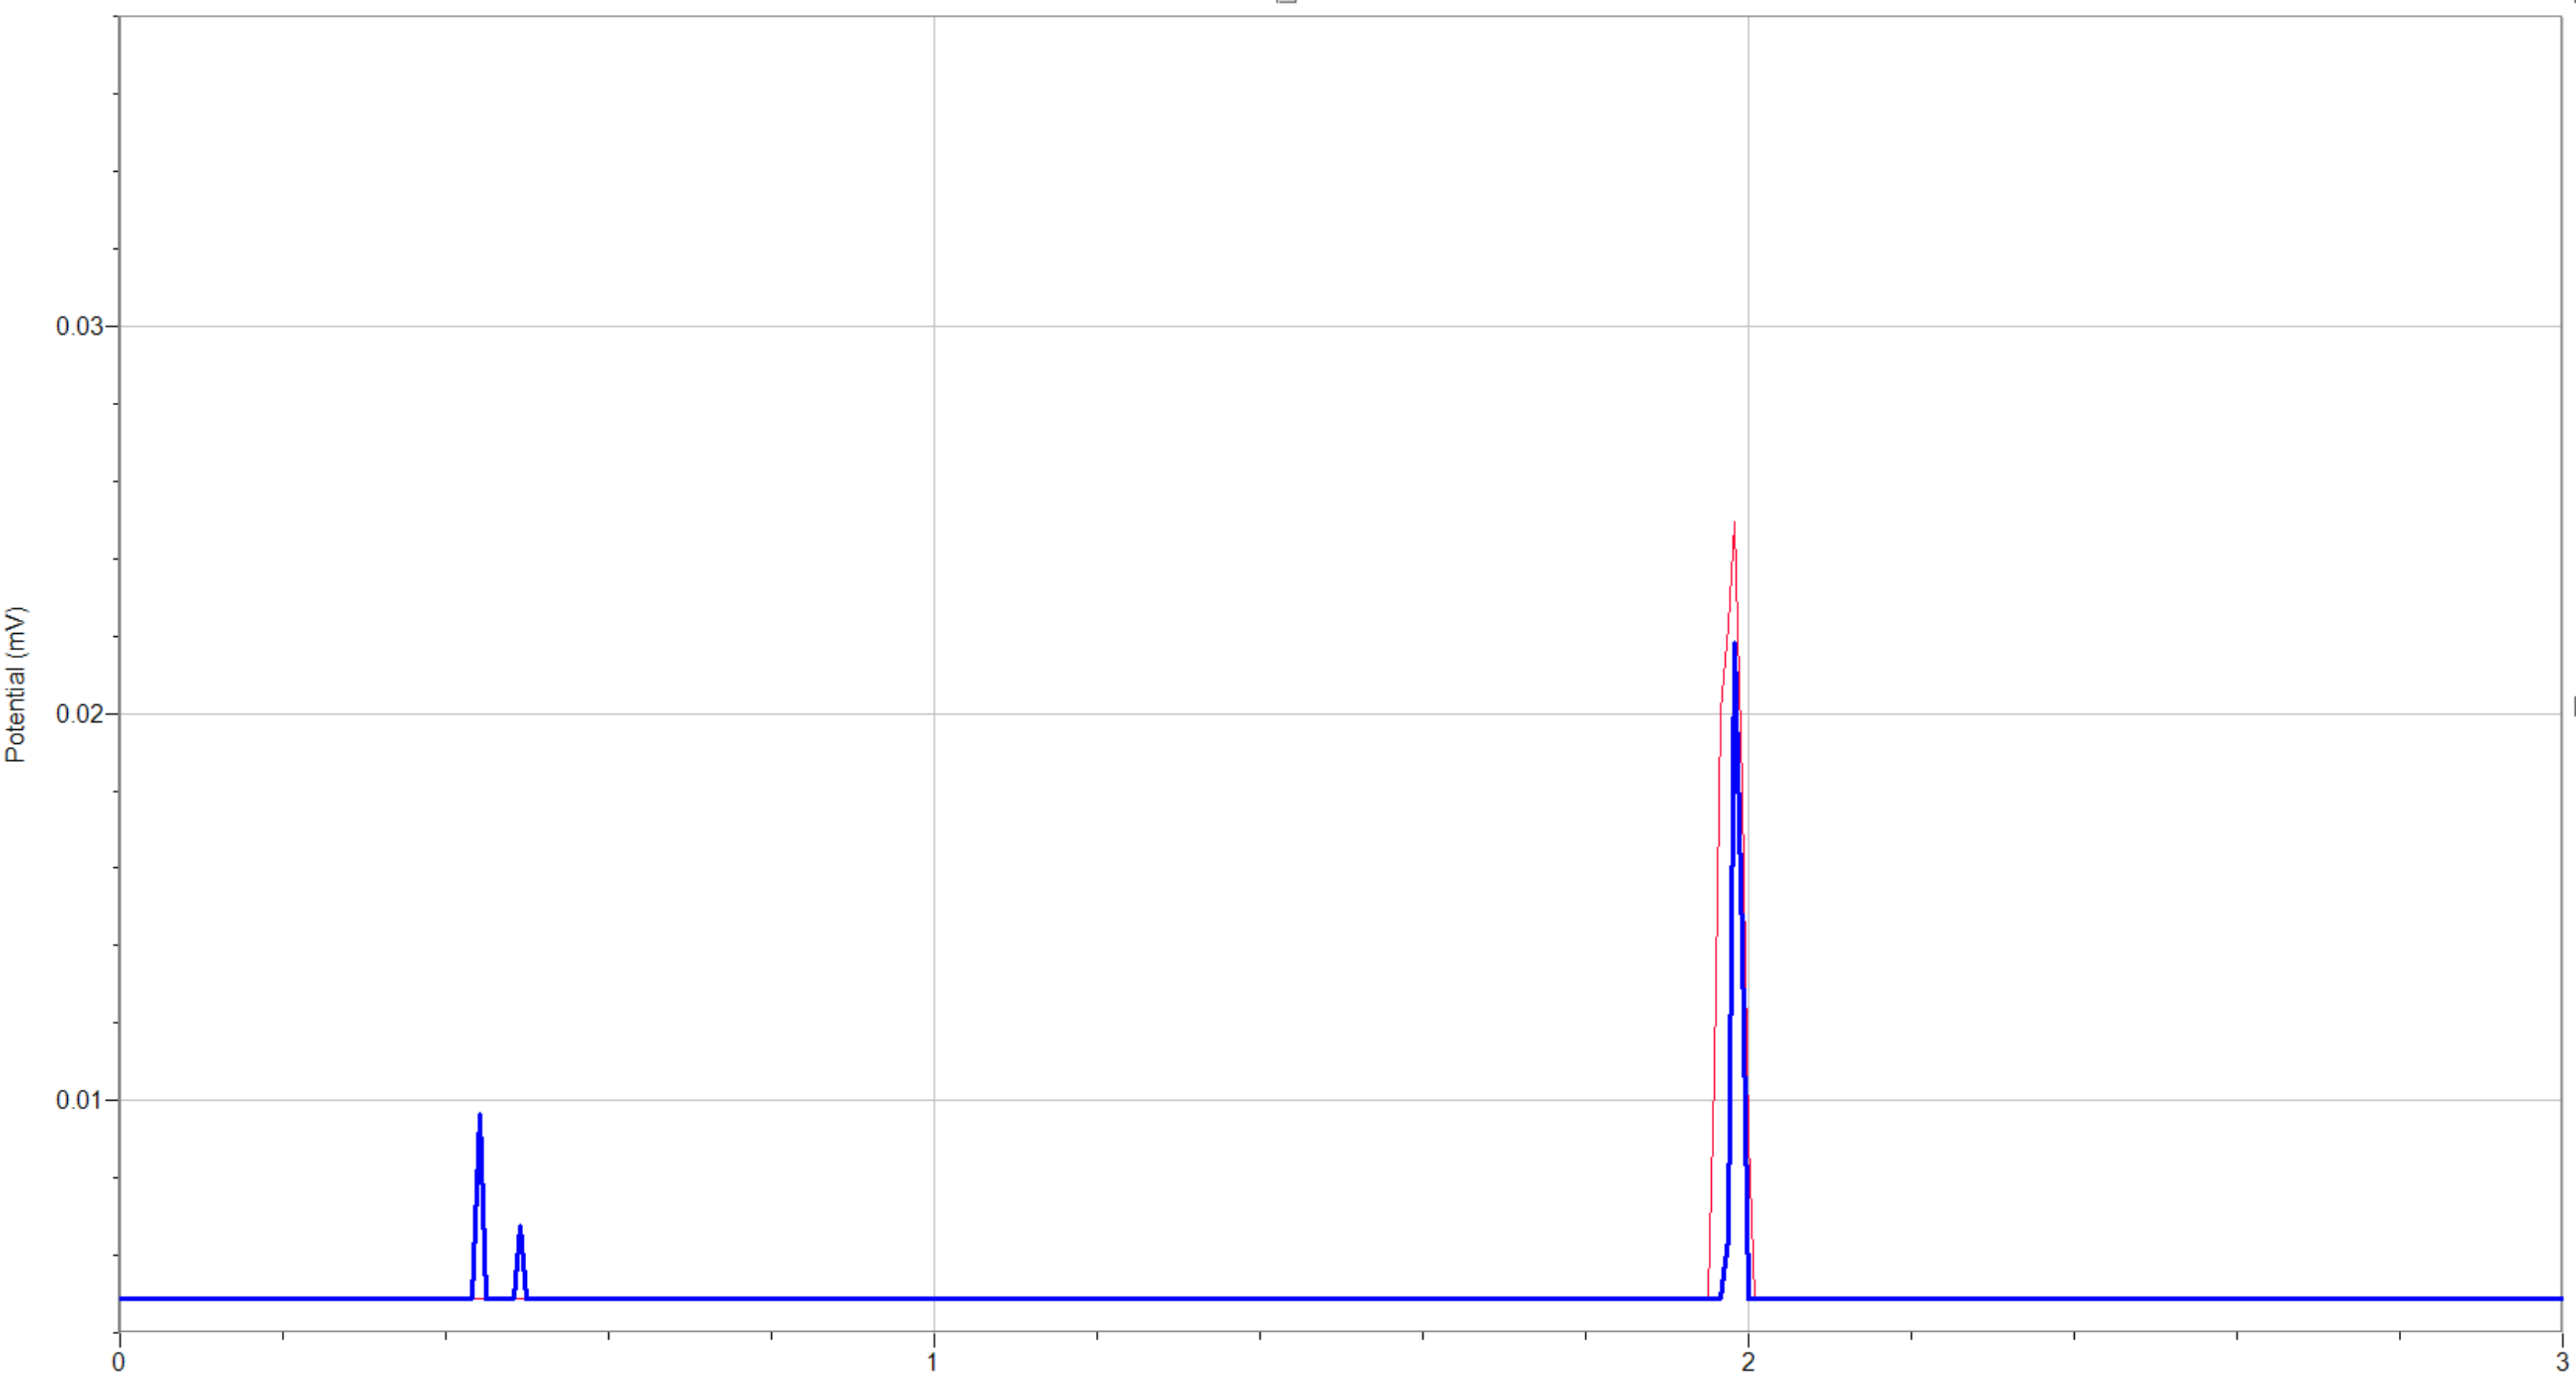
Data Analysis
Identify the peak from the caffeine standard in the first run.
- Measure the retention time (Rt) in minutes for the caffeine standard, (from START to PEAK). Use this Rt value to identify the caffeine peak on chromatograms from various beverages. Be sure to label identified peaks as “caffeine.”
- Calculate the area under the caffeine peak identified in the beverage sample using the “triangulation” method.
- Assume that the peak is a triangle.
- Measure and record the height of the peak in centimeters.
- Measure and record the width of the peak at ½ the height of the peak in centimeters.
- Determine the relative peak area (cm2) using the following equation:
- Assume that the peak is a triangle.
Area = (height) x (width at ½ height)
- Multiply the relative peak area by the AUFS value used during the run to calculate the adjusted peak area (cm2) for caffeine.
- Determine the caffeine concentration of a selected beverage.
- Using the caffeine calibration curve above, determine the caffeine concentration (mg/mL) that corresponds to your beverage’s adjusted peak area.
- Since each beverage sample was diluted in half with water, the real caffeine concentration will be twice the value found on the calibration curve.
- Calculate percent error.
- Record the name of the selected beverage.
- Use the links under Resources about Caffeine from the Introduction to find the accepted (literature) value for the caffeine concentration of the beverage selected. Be sure to convert units from the accepted value to match the units in the calibration curve (mg/mL).
- Use both the calculated experimental value and the literature value to calculate the percent error.