Cross Functional Projects
One of the key strengths of IDA+A is its cross-functional team structure, which brings together experts in analytics, assessment, data engineering, data governance, data science, and scenario planning. This collaborative approach allows IDA+A to serve as a thought partner to campus units, helping them unlock the full potential of their data in innovative and actionable ways.
IDA+A also works externally with departments across the university (e.g., Purdue IT, Business Intelligence Competency Center) to deliver technically robust data solutions.
Review the examples below to see how these internal and external collaborations come to life and how IDA+A’s approach creates meaningful impact across campus.
Melt prediction dashboard
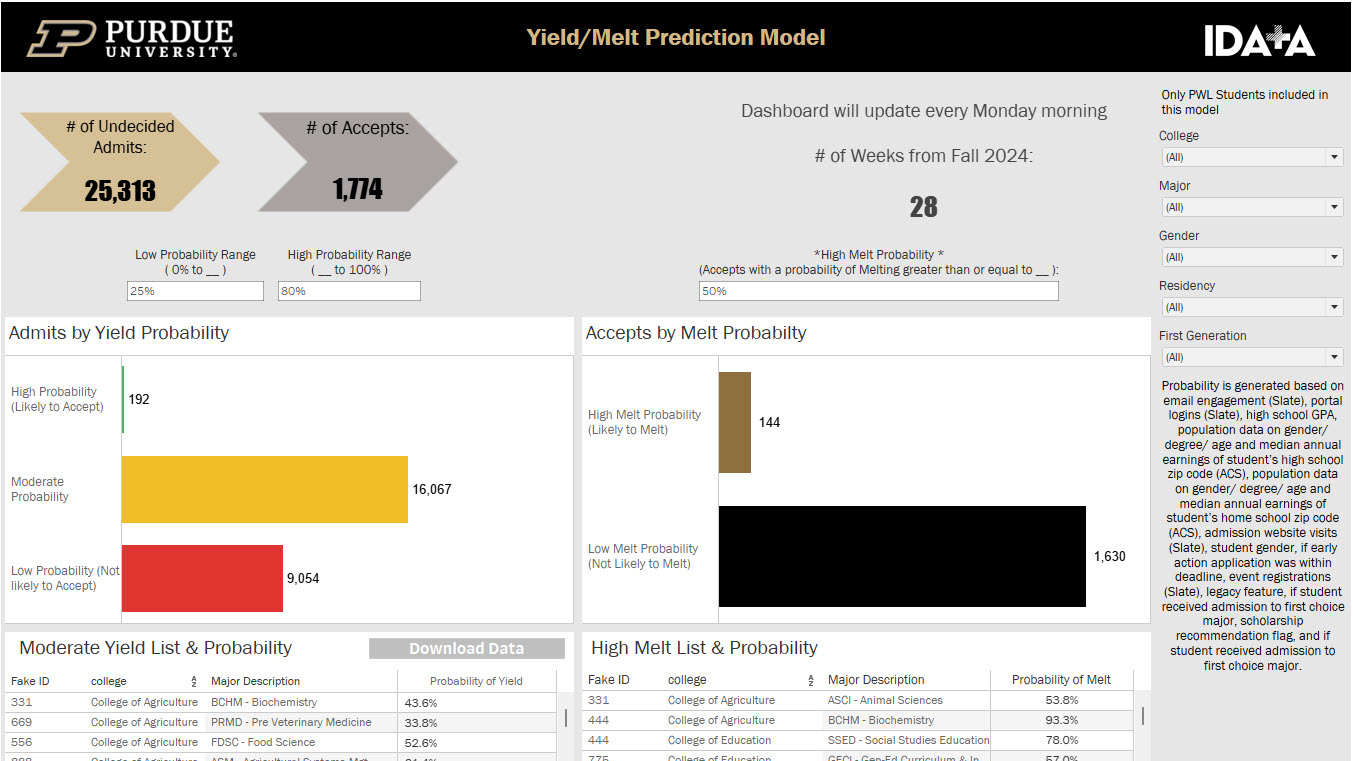
The Melt Prediction Dashboard empowers college-level recruiters with predictive insights into student yield and melt, enabling targeting outreach to optimize enrollment strategies.
An opportunity was identified at the college level by recruiters and college data managers. Recruiters have limited resources to connect with potential students, so they wanted to predictive insights into the likelihood a student will enroll (yield) and the likelihood a student will not show up after accepting admission (melt). Recruiters wanted to target students in the middle, not ones who were highly likely to attend or highly unlikely to attend.
The Data Science team began developing predictive models for yield and melt. This work incorporated features based on admissions data and recruiter insights.
The Scenario Planning team collaborated with Data Science to validate model assumptions, suggest relevant features based on admissions data, and defined how the data would be used by recruiting teams.
The Data Engineering team created automated data feeds from several data sources (Slate, Student Systems, and ACS) into Greenplum to support the melt prediction model.
From the automated data feeds in Greenplum, the Analytics team was able to create an interactive dashboard for college-level users to access in pursuit of information regarding melt predictions. The dashboard allows filtering and downloading of student IDs, enables targeted outreach via email or mail campaigns, and supports saving filtered links for direct use by marketing teams.
The new dashboard was documented in Data Cookbook, helping users understand the data fields, model, and general information about how to use the dashboard.
College recruiting and marketing teams who are interested in utilizing the Melt Prediction Dashboard can request access by contacting idata@purdue.edu.
Dining & Culinary Operations Data Optimization
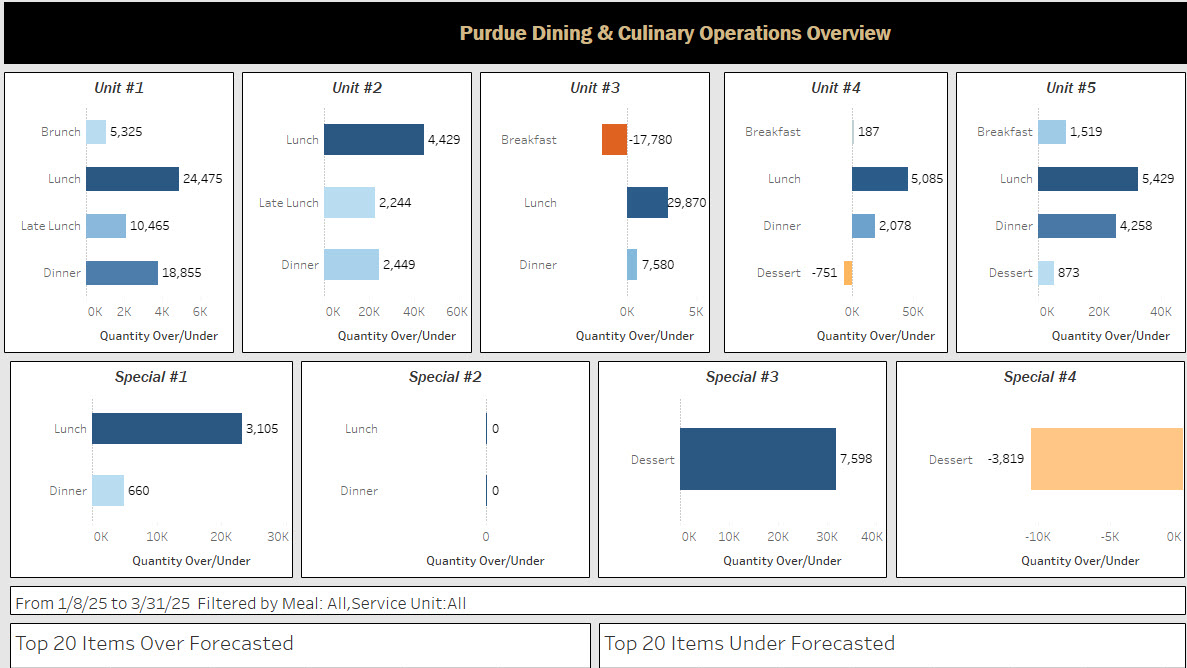
Purdue Dining & Culinary Operations partnered with IDA+A to modernize its data systems. The project replaced an inflexible vended solution with a robust, in-house platform that delivers accurate reporting and dynamic dashboards through Tableau.
A collaboration opportunity was identified within Purdue’s Dining Operations. The department was relying on a vended data solution that required manual entry adjustments, had limited flexibility around evolving reporting and monitoring needs, and limited customization options. Dining & Culinary Operations needed more robust reports to guide operational decision-making for the dining halls.
The Data Science team worked to clean up historical data and correct errors.
The Data Engineering team made the data accessible in GreenPlum for robust reporting and data visualization in Tableau.
The Analytics team utilized the cleaned data source from GreenPlum to create dashboards and reports in Tableau for the Dining Operations team. The implementation of the new data visualization and reporting tools allowed the dining department to discontinue the vended solution, saving $100,000 annually.
The Data Science team continues to partner with Dining to create statistical models to answer new questions as needs change.
If you would like to explore opportunities for collaboration with IDA+A, please submit a project request.