February 9-13, 2026
Love Data week
Purdue University students, faculty, and staff are invited to participate in the Boiler Up, Hammer Data Challenge. One student winner and one faculty/staff winner will advance to the Big Ten Academic Alliance (BTAA) Data Viz Championship.


WINNERS 2026
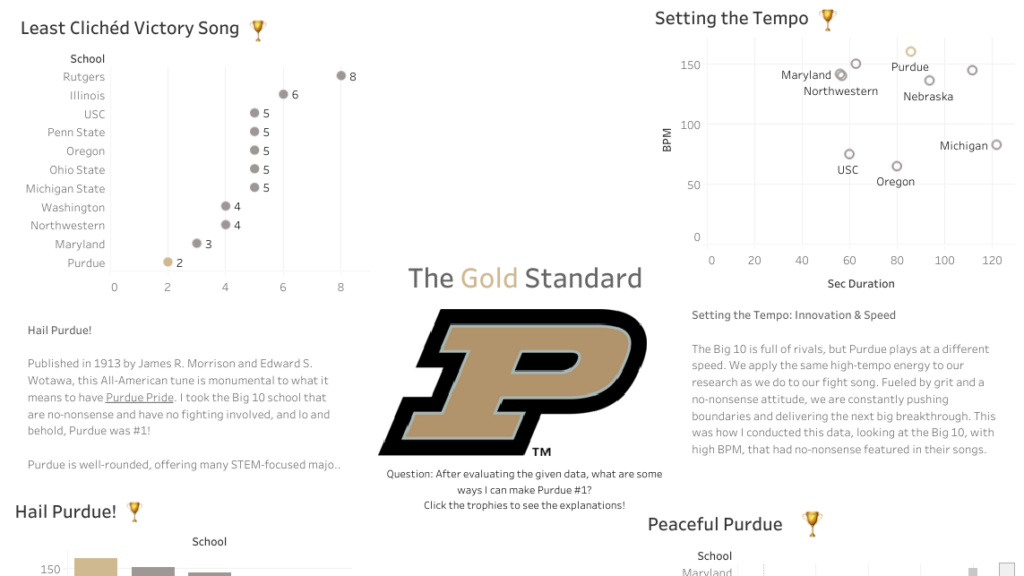
The Gold Standard
Winners: Kinaya Hines
Prize Amount: $1,000
*Will represent Purdue at the Big 10 Data Visualization Competition
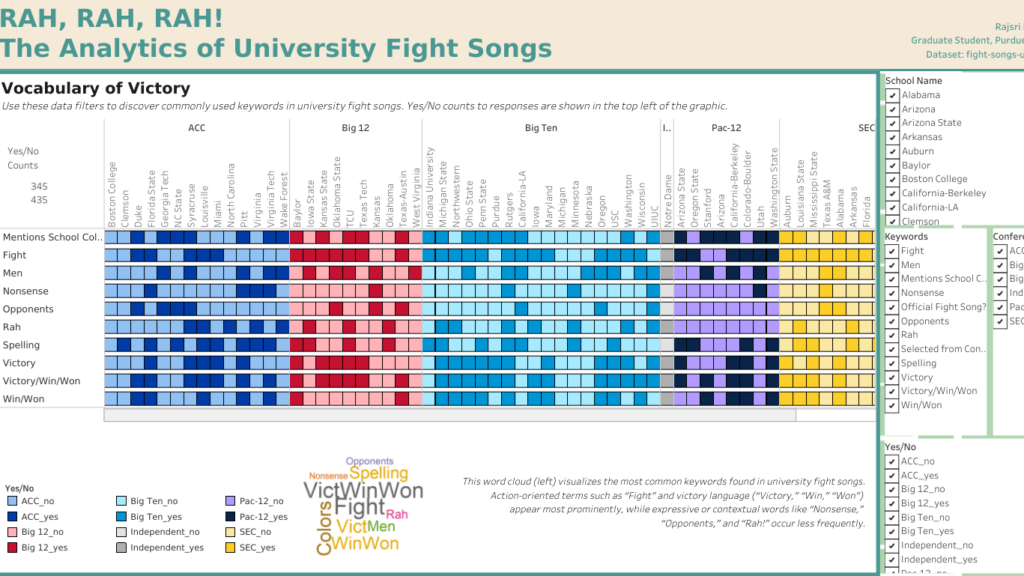
Rah, Rah, Rah! The Analytics of University Fight Songs
Winner: Rajsri Raghunath
Prize Amount: $500
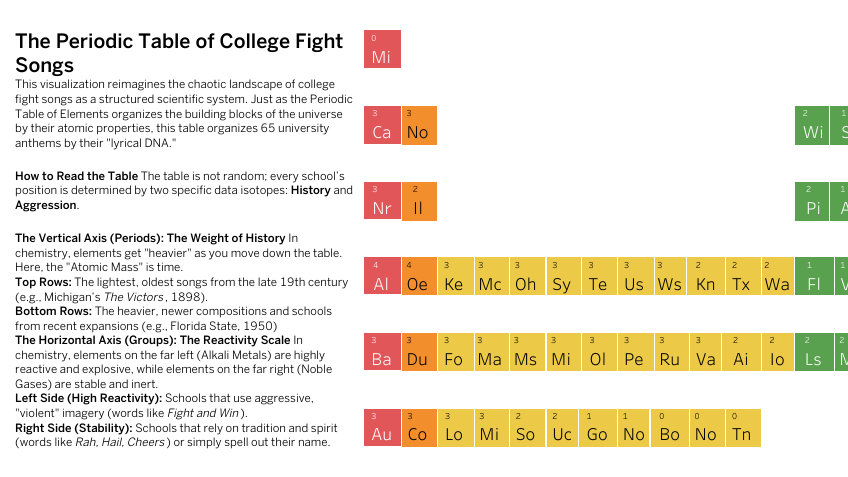
The Periodic Table of College Fight Songs
Winner: William Schnefke
Prize Amount: $500
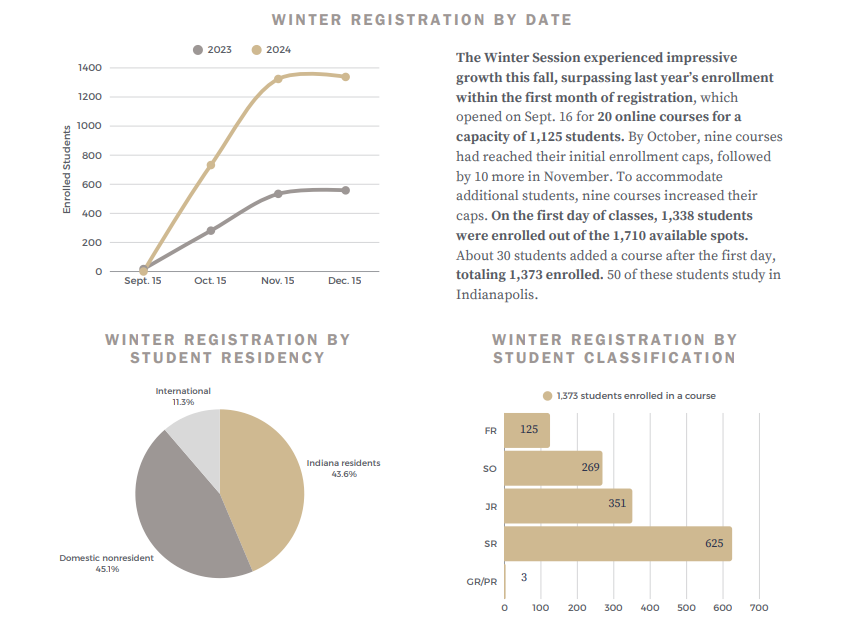
Undergrad Online Course Report
Winners: John Race et al.
*Will represent Purdue at the Big 10 Data Visualization Competition
Voting
Help Crown the BTAA Data Viz Champions and vote for the Love It! Award Winner (chosen by audience votes). Cast your vote for one student visualization and one faculty/staff visualization. Voting is open through 1 pm ET on Friday, February 13th.
Boiler Up, Hammer Data Challenge
Timeline
Students
Students may compete individually or in teams of two.
Your challenge is to use a Fight Song Data Set (or the updated date set with Big Ten Institutions) to devise a data visualization to address the question(s) of your choice. Your visualization should be publicly available for voting and judging. Identify a research question, have fun, and be creative!
Purdue Data Visualization Excellence Award
Prize Amount: $1,000
The Purdue Data Visualization Excellence Award recognizes the best overall data visualization that embodies a harmonious blend of analytical precision, creative flair, and effective communication. This award celebrates the mastery of chart types and best practices but also showcases the ability to convey complex information in a compelling and accessible manner. The winner of this award will proudly represent Purdue at the larger Big Ten Academic Alliance Data Viz Championship, representing the university’s commitment to advancing the art and science of data visualization.
This award is sponsored by Purdue’s Libraries and School of Information Studies and the Center for Business Communication in the Daniels School of Business
Daniels School of Business Excellence in Business Insights Award
Prize Amount: $500
The Daniels School of Business Excellence in Business Insights Award celebrates outstanding achievements in data visualization that directly address a business case, question, or strategically position the creator as a valuable employee or researcher for Lego. This award recognizes the fusion of analytical acumen and creative storytelling, emphasizing the impact of data visualization on driving informed decision-making in the business context.
This award is sponsored by the Center for Business Communication in the Daniels School of Business
Purdue Libraries Visionary Visualization Award
Prize Amount: $500
The Purdue Libraries Visionary Visualization award celebrates the most unique, creative, or novel data visualization solution that demonstrates an exceptional understanding of chart types for each visualization component. This award highlights the adept use of diverse visualization techniques and the application of best practices in design, ensuring an innovative and effective representation of complex information. The emphasis is on pushing the boundaries of conventional data visualization to unveil new insights.
This award is sponsored by Purdue’s Libraries and School of Information Studies
Submit Your Data Visualization
Students can submit their data visualization via this Microsoft form. The submission form closes at midnight on January 19, 2026. Voting information will be announced closer to the BTAA competition.
Faculty & staff
Submit an existing visualization that is used on your institution to share information. Visualizations can pertain to the institution as a whole or to a specific initiative or population. Submissions should follow institutional data policies (e.g. disable download of identifiable data) and must be made available publicly on the web for the duration of the challenge.
- Bragging rights at Purdue and with your Big 10 Peers
- One visualization will be selected to represent Purdue in the Big Ten Academic Alliance Data Viz Championship
Ways to Get Involved
- Share this opportunity with students.
- Nominate a peer’s work or submit your visualization via this Microsoft form by 11:59 pm on January 19th