Project 3A: Coordinated Actin-Myosin Morphogenesis in Zebrafish Epiboly
Objectives
Project 3A quantifies Ca2+ transients in three distinct cell layers undergoing epiboly in zebrafish embryos. Objectives: (1) visualize Ca2+ dynamics and coordination between layers during epiboly progression; (2) determine relationship between Ca2+ transients and regulation of actin and microtubule dynamics; (3) test mechanical properties and their regulation in different cell layers of the yolk cell actomyosin ring.
Research Highlights
Modeling Epithelial Morphogenesis and Cell Rearrangement during Zebrafish Epiboly
Computational model of epithelial morphogenesis during zebrafish epiboly.
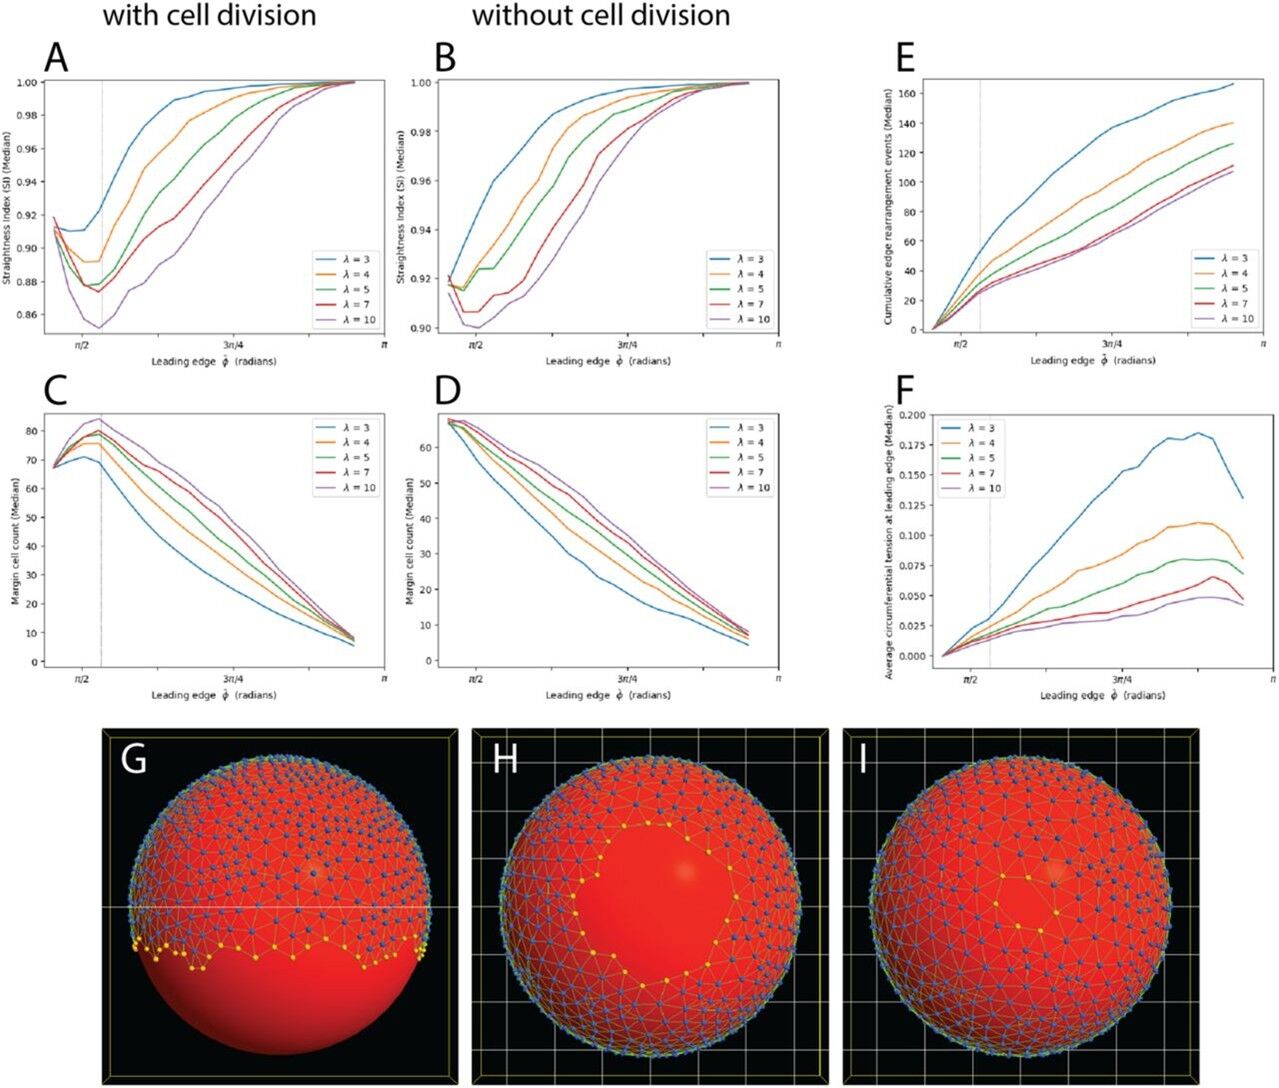
Figure 11. Rate of EVL edge straightening correlates with the strength of the bond angle constraint. AF. Change in several metrics over the course of epiboly. Each plot line represents median values of multiple simulation runs for each given strength (λ) of bond angle constraint (A,C,E,F: with cell division, 56 runs per treatment; B,D: without cell division, 32 runs per treatment), plotted against epiboly progress (the leading edge position over time). Vertical lines in A, C, E, F mark the cessation of cell division at 55% epiboly (polar angle ϕ ≅ 0.53π). A,B: Straightness index, in runs with cell division (A) and without cell division (B). The rate of increase of SI over the course of epiboly correlates negatively with λ. (The initial decrease in SI that occurs in most of the treatments in (A) likely is partly due to cell division at the margin, but not entirely: the same decrease occurs when cell division is disabled (B), though only at higher values of λ.) C,D: Margin cell count, in runs with cell division (C) and without cell division (D). The model allows cells both to enter and to leave the margin; the change in cell count over time is therefore the net change. Note that despite differences in the time course of margin cell population decrease, all treatments result in a similar net loss of ∼60 margin cells by the end of epiboly. The initial net increase in margin cell count that occurs in most of the treatments in (C) is due entirely to cell division during early epiboly, since no such increase occurs when cell division is omitted from the model (D). E: Cumulative margin cell rearrangement events. The total number of events correlates negatively with λ. F: Tension along the leading edge. The rate of increase in tension correlates negatively with λ. G-I: Time points in a single simulation run with λ=10; polar angle of the leading edge ϕ=0.58π, 0.87π, 0.95π (about 63%, 96%, 99% epiboly). Straightening is delayed until much later in epiboly.
Minsuk, S.B., et al. 2025. Modeling Epithelial Morphogenesis and Cell Rearrangement during Zebrafish Epiboly. bioRxiv, 2025.02.12.637977. Submitted to npj Systems Biology and Applications.