7 November, 2024
What Is Value Stream Mapping (VSM)?
What is a value stream? A value stream represents the series of actions an organization takes to design, create, and deliver a product or service to its customers, from the initial idea to the final customer experience. Each step in this process is essential to adding value.
Value stream mapping is a technique — developed from Lean manufacturing — that organizations use to create a visual guide of all the components necessary to deliver a product or service, with the goal of analyzing and optimizing the entire process.
The process of creating a value stream map takes all the necessary people, processes, information and inventory, and displays them in a flowchart format. By visualizing all elements that go into creating a product or service, organizations can apply lean principles to reduce waste in specific areas of their processes.
In this article, we’ll discuss what value stream mapping is and provide guidance for how to develop an effective value stream map.
Value Stream Mapping: An Essential Part of the LSS Toolkit
As companies and organizations face increasing competition and changing customer demands, they’re using Lean management techniques to become better at what they do.
Learning key Lean Six Sigma (LSS) tools can also help your career, by making you more attractive to new employers or enhancing the value you provide in your current workplace.
It is important to note, however, that value stream maps are excellent tools within the Lean Six Sigma methodology. Learning specific tools in terms of how they benefit organizations and within the context of the LSS methodology provides the biggest benefit, and this is what makes Purdue’s online Lean Six Sigma certificate programs valuable —they provide both the tools and the larger context in which they are used to more effectively lead LSS projects.
Value Stream Mapping Examples
Value stream maps can be created with flowchart software, and many products will have the core symbols necessary embedded within their symbol libraries. The example below shows what a typical value stream map might look like:
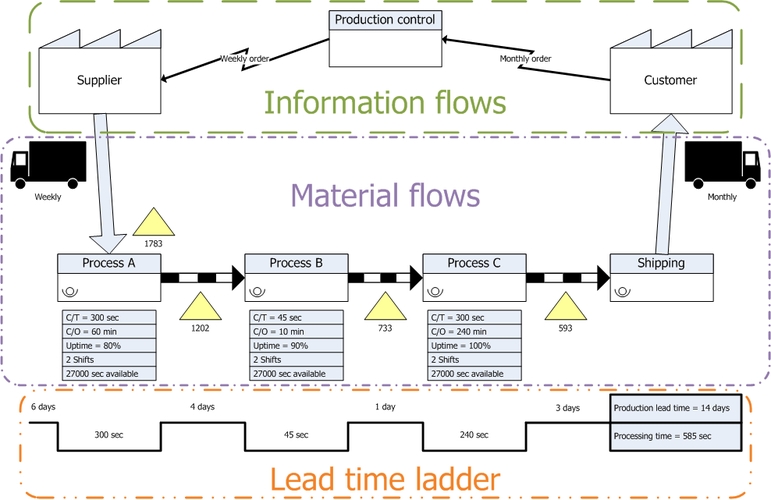
Source: Wikipedia
However, you can also create value stream maps on a white board and include post-its with additional information. This kind of map may look something like this:
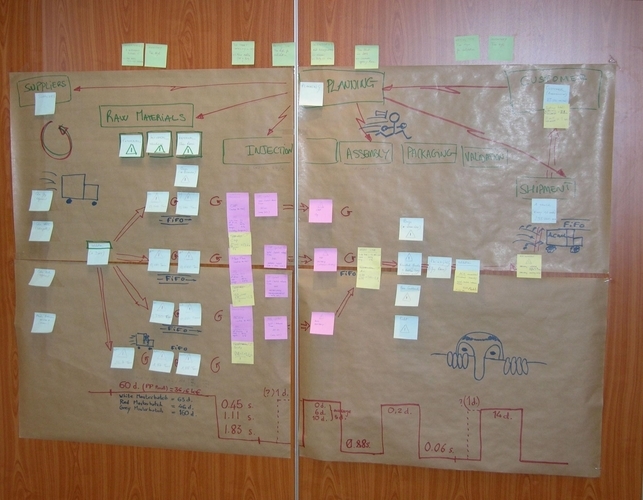
Source: Wikipedia
Request
Information
To learn more about Purdue University’s online Lean Six Sigma Training and Certification program and , fill out this form. You can also email us at LSSonline@purdue.edu or call us at (765) 253-6940 to speak to one of our enrollment specialists.
Why Do We Use Value Stream Mapping (VSM)?
The purpose of VSM is to maximize value and minimize waste in a number of different ways including:
- Facilitating clear communication and collaboration
- Encouraging continuous improvement of a process
- Enabling culture change within an organization
- Creating visualizations of delays, excess inventory and production constraints
These ideas were originally put into practice by the highly regarded Toyota Production System some 70 years ago. Toyota established requirements that when an error occurred during an automated process, production would be stopped immediately. And, only what was needed would be done at each step in the process. This allowed them to maintain both quality and speed in making cars.
What made Toyota’s system so productive and valuable was that it took into account the flow of the entire process, rather than just one machine at a time. Each step in the flow informed the next, increasing production speed at lower costs and maintaining quality. This framework is still in practices across numerous organizations and it is a cornerstone of the manufacturing industry.
Today, Lean and Six Sigma are used across industries, including healthcare, technology, manufacturing and finance, and there is continued demand for experts with Lean Six Sigma knowledge. According to a study by PwC, 80-90% of tasks in typical business processes are wasteful because they do not add any value for the customer.
How to Create a Value Stream Map (VSM)
The process of drawing a value stream map can be done using a template, software, drawing or even on a whiteboard or piece of paper. Before creating your map, it will be helpful to think about and outline all the processes and stakeholders involved. From there, you can start to visualize how these process and stakeholders relate to each other.
There are a range of standardized symbols used for value stream mapping, including those for processes, identifying customers/suppliers and others. Popular flowchart software like Edraw and Lucidchart include them in their symbol libraries.
Related Content: What is a Six Sigma Process Map?
There are several other symbols that can be used to represent different aspects of the process, and becoming familiar with them can help you create value maps more efficiently.
Real-World Value Stream Mapping Examples
To better understand when and how to use value stream mapping, it may help to look at some case studies of real-world implementations.
For example, a rope manufacturing company used value stream mapping to show the layout of its manufacturing floor. They organized its material flow, saving six and a half minutes per rope order, which is 33% of material handling time.
In another case, executives from an IT services company had never met each other in person until they performed a value stream mapping exercise. The value stream mapping exercise brought them together and highlighted areas where formal collaboration processes would improve communication across the entire organization.
Sometimes the answers that come from seeing your entire process visualized in a logical way can shine a light on inefficiencies and lead you to make major changes that improve efficiency or even shift perspectives on how your organization operates.
In fact, SD Times has called 2019 “the year of the value stream.” Company leaders are seeking to remove “silos,” where people are working separately towards their own goals, and refocus on customers. Ultimately, though, the most benefit from value stream mapping comes from focusing not just on process improvement, but on what the result means for the customer.
Value Stream Your Career with an LSS Certificate
Advanced Lean Six Sigma knowledge can also be a key asset for your career. LSS techniques have been utilized across industries and departments to unify organizations and drastically cut down on wasted time and resources. For example, PayScale shows that the average salary for a professional with Lean Six Sigma Green Belt certification is $94,000, while those with Lean Six Sigma Black Belt certification earn an average of $112,000.
In addition, the average salaries for specific roles, such as operations manager or mechanical engineer, are considerably higher for those with LSS certification compared to the average for all professionals in those roles.
About Purdue’s Online Lean Six Sigma (LSS) Certificate Program
Purdue University offers comprehensive online Lean Six Sigma (LSS) certificate programs designed for working professionals with varying levels of Lean Six Sigma experience. The online Lean Six Sigma certificate courses prepare professionals to satisfy the immense demand for Lean expertise, skills and certification.
Purdue offers the following courses 100% online:
Ready to Learn More?
