I started discussing about fertilizers in the last report. I want to further expand fertilizer concepts in this and perhaps, a few more reports. The purpose of this report is to provide information on fertilizer needs of green leaf lettuce grown in containers filled with a peat based media. The recommendations from this report should NOT be used for hydroponically grown lettuce.
How did we conduct the experiment? We grew green leaf lettuce in 4-inch containers that were filled with SunGrow mix #8. Eight containers were placed on a standard tray without holes. The experiment was conducted during the winter at Purdue horticulture greenhouse facility under supplemental lighting conditions. Every alternate day, trays were sub-irrigated with one of the five fertilizer concentrations: 250, 208, 166, 150 and 83 ppm N or electrical conductivity (EC) of 3.0, 2.5, 2.0, 1.8 and 1.0 dS/m, respectively (note: 1 dS/m = 1 mS/cm = 1000 µS). About 1 L of fertilizer solution was added during the 1st and 2nd weeks and 2 L were added during the remaining weeks to each tray. Fresh and dry weight of lettuce plants was measured after 5 weeks of growth in each treatment. The experiment was repeated twice and average values are shown in this report.
How much fertilizer is optimal?
The representative trays from different fertilizer treatments are placed side by side in the picture below to compare how plants looked in different treatments. The numbers in the picture represent EC of the fertilizer in each treatment.
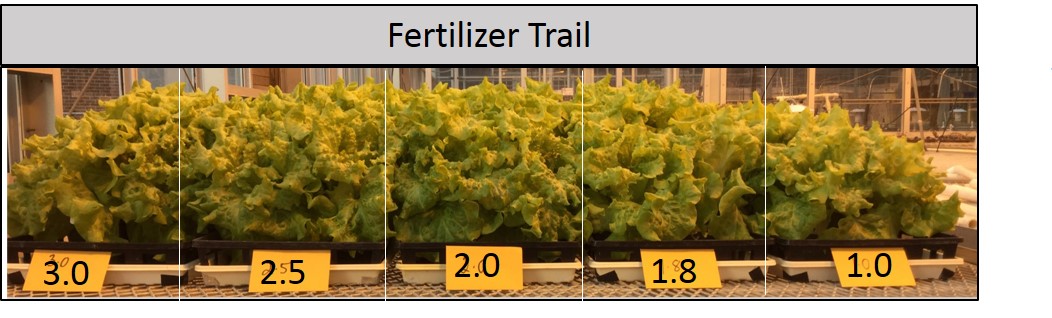
Results show that a fertilizer concentration of 166 ppm N or an EC of 2.0 dS/m applied every alternate day was optimum for green leaf lettuce under sub-irrigation. The volume of fertilizer solution will depend on the growth stage and number of containers. In this study, each container received approximately 125 mL every alternate day during the first two weeks and 250 mL every alternate day during the next three weeks.
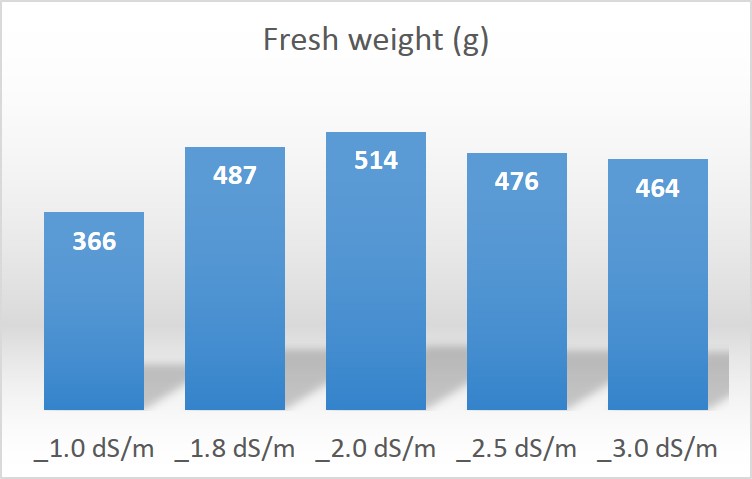
Average fresh weight (g) of eight plants in different fertilizer treatments from two different studies is shown in the graph below. Fresh weight increased nearly 30, 5, 7 and 10 % in the 2.0 vs. 1.0, 1.8, 2.5 and 3.0 dS/m treatments respectively.
Below is another opportunity if you are interested to learn more about lettuce production: