
| RELATED INFO |
| * Vulcan |
| * Kevin Gurney |
| * U.S. Carbon Cycle Science Program |
| * Purdue Envision Center for Data Perceptualization |
![]()
April 16, 2008
Top CO2 emitting counties in the United States identified
WEST LAFAYETTE, Ind. -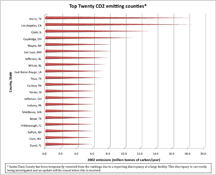 |
The top three counties include the cities of Houston, Los Angeles and Chicago.
Kevin Gurney, an assistant professor of earth and atmospheric science at Purdue University and leader of the carbon dioxide inventory project, which is called Vulcan, says the biggest surprise is that each region of the United States is included in the ranking.
"It shows that CO2 emissions are really spread out across the country," he says. "Texas, California, New York, Florida, New Mexico, the Midwest — Indiana, Illinois, Ohio — and Massachusetts are all listed. No region is left out of the ranking, it would seem."
The listing of the counties includes the largest city in each county. The numbers are for millions of tons of carbon emitted per year.
1. Harris, Texas (Houston), 18.625 million tons of carbon per year
2. Los Angeles, Calif. (Los Angeles), 18.595
3. Cook, Ill. (Chicago), 13.209
4. Cuyahoga, Ohio (Cleveland), 11.144
5. Wayne, Mich. (Detroit), 8.270
6. San Juan, N.M. (Farmington), 8.245
7. Santa Clara, Calif. (San Jose), 7.995
8. Jefferson, Ala. (Birmingham), 7.951
9. Wilcox, Ala. (Camden), 7.615
10. East Baton Rouge, La. (Baton Rouge), 7.322
11. Titus, Texas (Mt. Pleasant), 7.244
12. Carbon, Pa. (Jim Thorpe), 6.534
13. Porter, Ind. (Valparaiso), 6.331
14. Jefferson, Ohio (Steubenville), 6.278
15. Indiana, Pa. (Indiana), 6.224
16. Middlesex, Mass. (Boston metro area), 6.198
17. Bexar, Texas (San Antonio), 6.141
18. Hillsborough, Fla. (Tampa), 6.037
19. Suffolk, N.Y. (New York metro area), 6.030
20. Clark, Nev. (Las Vegas) 5.955
The current emissions are based on information from 2002, but the Vulcan system will soon expand to more recent years.
Gurney says Vulcan, which is named for the Roman god of fire, quantifies all of the CO2 that results from the burning of fossil fuels such as coal and gasoline. It also tracks the hourly outputs at the level of factories, power plants, roadways, neighborhoods and commercial districts.
"It's interesting that the top county, Harris, Texas, is on the list because of industrial emissions, but the second highest CO2 emitting county, Los Angels, California, is on the list because of automobile emissions," Gurney says. "So it's not just cars, and it's not just factories, that are emitting the carbon dioxide, but a combination of different things."
Gurney notes that some counties on the list are there but they are producing goods or power for occupants of a different area.
"Counties such as Titus, Texas, Indiana, Pennsylvania, and Clark, Nevada, are dominated by large power production facilities that serve populations elsewhere," he says.
"My favorite one on the list is Carbon, Pennsylvania," Gurney adds.
The three-year project, which was funded by NASA and the U.S. Department of Energy under the North American Carbon Program, involved researchers from Purdue University, Colorado State University and Lawrence Berkeley National Laboratory.
The Vulcan data is available for anyone to download from the Web site at https://www.eas.purdue.edu/carbon/vulcan. Smaller summary data sets that offer a slice of the data and are easier to download also are available for non-scientists on the Vulcan Web site. These can be broken down into emission categories, such as industrial, residential, transportation, power producers, by fuel type, and are available by state, county, or cells as small as six miles (10 kilometers) across.
A video of the maps and simulations of the atmospheric fate of fossil fuel CO2 also can be viewed on YouTube at https://www.youtube.com/watch?v=eJpj8UUMTaI.
Writers: Steve Tally, (765) 494-9809, tally@purdue.edu
Elizabeth Gardner, (765) 494-2081, ekgardner@purdue.edu
Sources: Kevin Gurney, (765) 427-8680, kgurney@purdue.edu
Purdue News Service: (765) 494-2096; purduenews@purdue.edu
Note to Journalists: A chart showing the top twenty CO2 emitting counties is available, as are broadcast-quality and high-definition animations of the Vulcan maps. Contact Steve Tally at tally@purdue.edu.
Photo CAPTION:
This is a graph of the 20 U.S. counties that produced the greatest amount of the greenhouse gas carbon dioxide. A research team led by Purdue professor Kevin Gurney created a system, called Vulcan, that examines carbon dioxide emission at local levels on an hourly basis. The graph is based on data from 2002, the most current data available. (Purdue News Service graphic/Gurney lab)
Photo: A publication quality photo is available at: https://www.purdue.edu/uns/images/+2008/gurney-CO2.jpg
To the News Service home page