VACCINE Paper Presentations at EuroVis 2019
June 15, 2019
VACCINE Director Dr. David Ebert and graduate researcher Calvin Yau attended the 2019 EuroVis conference on June 3-7 in Porto, Portugal, where they presented two papers: “Bridging the Data Analysis Communication Gap Utilizing a Three-Component Summarized Line Graph” by Calvin Yau, Dr. Morteza Karimzadeh, Dr. Chittayong Surakitbanharn, Dr. Niklas Elmqvist, and Dr. David Ebert, and “An Ontological Framework for Supporting the Design and Evaluation of Visual Analytics Systems” co-authored and co-presented by Dr. David Ebert and Dr. Min Chen from Oxford University.
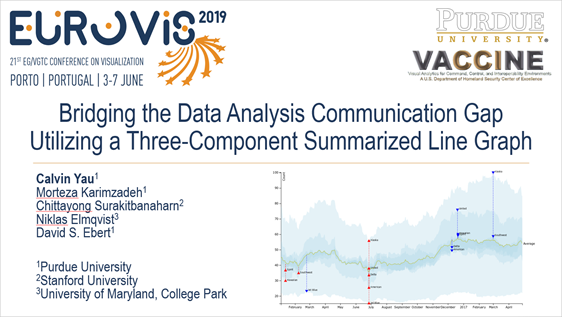
“Bridging the Data Analysis Communication Gap Utilizing a Three-Component Summarized Line Graph,” presented on June 5th, analyzes the process of effective visualization techniques and communicating representative data to decision-makers. The title slide can be seen in the image above.
Abstract—Communication-minded visualizations are designed to provide their audience—managers, decision-makers, and the public—with new knowledge. Authoring such visualizations effectively is challenging because the audience often lacks the expertise, context, and time that professional analysts have at their disposal to explore and understand datasets. We present a novel summarized line graph visualization technique designed specifically for data analysts to communicate data to decision-makers more effectively and efficiently. Our summarized line graph reduces a large and detailed dataset of multiple quantitative time-series into (1) representative data that provides a quick takeaway of the full dataset; (2) analytical highlights that distinguish specific insights of interest; and (3) a data envelope that summarizes the remaining aggregated data. Our summarized line graph achieved the best overall results when evaluated against line graphs, band graphs, stream graphs, and horizon graphs on four representative tasks.
“An Ontological Framework for Supporting the Design and Evaluation of Visual Analytics Systems” is the culmination of a five-year collaboration between Dr. Min Chen, a member of the UK Visual Analytics Centre (UKVAC) and Dr. David Ebert. This paper presents a systematic approach to the design and evaluation of visual analytics workflows and describes an abstract reasoning methodology for analyzing the causal relationships among symptoms, causes, remedies, and side-effects in terms of the four primary components (statistics, algorithms, visualization, and interaction) in visual analytics workflows. It is supported by a website: IVAS (Improving Visual Analytics Systems). The paper itself will be published in Computer Graphics Forum later this month.


