 Purdue News
Purdue News
|
|
|
May 11, 2001 New technique illuminates events obscured in the geologic recordWEST LAFAYETTE, Ind. – A Purdue University researcher known for his studies on evolution and the extinction of the dinosaurs has developed a tool that unmasks short-term events previously overlooked in the geologic record.
The technique, called stratigraphic plane analysis, replaces traditional one-dimensional analyses with a multidimensional display of geologic data. It can be used to analyze data from fossil records, archeological studies or any type of spatial geologic data, says William Zinsmeister, a professor of geosciences who developed the technique. Initial results using the technique reveal for the first time several short-term climatic events during the late Cretaceous period that may have played a significant role in mass extinctions at the end of that geologic era, Zinsmeister says. The data coincide with findings from deep-sea core drillings that show short-lived fluctuations in the climate at that time. Details of the new technique and findings were published in the March issue of the Journal of Geology. "When you look at the history at the end of the Cretaceous, what we know is there was a long-term decline in temperature, and the climate was getting cooler and cooler," Zinsmeister says. "We often view it as a simplistic gradual decline, but if you look at a modern weather pattern, you see variations from year to year, so we know that weather does not have a smooth flow. "Until now, scientists have not been able to see those perturbations in the geologic record. Using this technique we now can detect these short-term events." Since the early 1980s, questions about the nature, sequence and timing of the mass extinction event at the end of the Cretaceous period have generated considerable debate. The Cretaceous period, which ranged from 140 million years ago to 65 million years ago, was characterized by a great development and subsequent extinction of many life forms, including dinosaurs and primitive birds. "It became quite apparent when controversy began to heat up that patterns of how things became extinct near the end of the Cretaceous were just as important as the extinction itself, because the patterns tell us something about what actually happened," he says. The debate also revealed several limitations in traditional methods designed to study fossil records, forcing scientists to re-evaluate how they collect, classify and graphically represent their data, Zinsmeister says. "For 150 years, paleontologists have been developing range charts that plot fossils through the dimension of time," Zinsmeister says. "Though this method works well in many instances, it falls short of answering our questions when looking at how life forms change over short periods of time." In efforts to resolve these questions, scientists have applied a number of different statistical analyses to the data. What they've come up with is a variety of scenarios, based on the statistical approach used in the study, Zinsmeister says. "The real problem is, when you look at the data set using conventional methods, you're looking at only one dimension – time," he says. "These data were collected over a large geographic area, but when we view the data in one dimension, the geographic component within the data set is obscured." Using off-the-shelf spreadsheet software, Zinsmeister developed a method to merge and graphically display the time and geographic components within a data set. "By doing this on the computer, I can look at an enormous amount of data and see how these fossils were distributed in space and time," he says. "When you see that, all of a sudden the world looks a lot different." In addition, the new technique makes it possible to recognize the significance of single occurrences or short-term events. "When people do statistical analyses of the data and find a single point, they just throw it out because they can't analyze in terms of confidence levels, or they consider it just an artifact," he says. "But these single point events can be very important when you recognize that these are real events, not just an artifact." Zinsmeister says he learned this lesson when he analyzed some data he had collected in Antarctica using his new technique. The data represents approximately 50,000 fossils from 300 localities he had collected over an area of 70 square kilometers on Seymour Island, adjacent to the northeastern tip of the Antarctic Peninsula. Using conventional charts, Zinsmeister points to a fossil find representing a group of cephalopods – a class of mollusks. Because these creatures are found along a single horizon – a paleological term used to describe a layer of fossils – the event would generally be considered an artifact and ignored. "This ammonite has a long history of about 5 million years in the Western Pacific, but only occurs on one horizon on Seymour island, just before the extinction at the end of the Cretaceous," he says. "When you look at the occurrence from a spatial perspective, it tells you right away that this is not an artifact, it's something real. "This tells us that some event, such as a warming event, may have allowed that group of animals to return to the Seymour Island area." In yet another example, Zinsmeister shows how a giant form of another type of mollusk, known as an ammonite, occurs at only one point in time. "Looking at the data with traditional techniques, one wouldn't distinguish this giant ammonite occurrence from the others," he says. "But when you see it graphically, you can see that the giant ammonites line up along a single horizon. This begs the question, what's going on here? In this case, the sudden occurrence of this big ammonite may represent a drop in the sea level at that time." The data may help scientists better understand historical events and may even help put the controversy about the demise of the dinosaurs to rest, Zinsmeister says. "Here, we're able to see what the real world looked like," he says. "We have this long-term decline in climate, but superimposed upon it we have these perturbations – where you have short-term warming events or the rise and fall of sea levels – and this adds to the distress on the marine animals at that time. Taking this into account, the mass extinction would most reasonably be viewed as a conjunction of events." Zinsmeister says it may require some additional time for the program to be fully integrated into paleontological studies. "One of the most fascinating things about this little exercise is how people in the scientific community react to it," he says. "There are some people who are still apprehensive of computers. Other paleontologists may not appreciate it because this goes against the way we have approached these studies of distribution of life for more than 100 years. "I'm not saying we should stop using the traditional methods, but it's time to merge traditional methods with new computer-based technologies." Zinsmeister's research at Purdue is funded by the National Science Foundation. Source: William Zinsmeister, (765) 494-0279; wjzins@purdue.edu Writer: Susan Gaidos, (765) 494-2081; sgaidos@purdue.edu Purdue News Service: (765) 494-2096; purduenews@purdue.edu
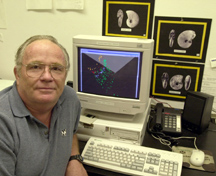
PHOTO CAPTION: Purdue paleontologist William Zinsmeister shows how a new computer tool he developed can display fossil finds from the Antarctic in two dimensions. (Purdue News Service Photo by David Umberger) A publication-quality photograph is available at the News Service Web site and at the ftp site. Photo ID: Zinsmeister.analysisABSTRACT Late Maastrichtian Short-Term Biotic Antarctic Peninsula William J. Zinsmeister The use of stratigraphic plane analysis, a new graphical technique to view simultaneously both spatial and stratigraphic distribution of biostratigraphic data, has documented important short-term oceanic events in the high southern latitudes during the Maastrichtian. Single-occurrence or restricted-occurrence horizons on Seymour Island using traditional one-dimensional (temporal) composite range charts have been viewed as artifacts of preservation or collection failures. When the Seymour Island data are evaluated from a spatial perspective using stratigraphic plane analysis, it is clear that these restricted-occurrence horizons are not due to collection failures or incomplete preservation but represent important biotic events, probably associated with widespread thermal events documented in the deep-sea record and to mid-Maastrichtian changes in sea level. These short-term events, in combination with the long-term decline in temperature at the end of the Cretaceous, may have been important contributory factors leading to the extinction event at the end of the Cretaceous.
|
